Thursday-Adjusted Pick Popularity
Have you ever noticed the P% on a big Thursday favorite drops when you look again on Sunday?
Here's the reason for that.
First, it's important to remember that P% means the number of picks that have selected a team divided by the total number of picks submitted up to that point in time. It is not based on the total number of alive tickets that will eventually make picks for the week.
All the picks for teams playing on Thursday must be placed by kickoff. That means all remaining picks made later in the week will be on non-Thursday teams. So during the time from Thursday kickoff until Sunday kickoff, the P% of Thursday teams will drop while P% of other teams will rise.
For example, if a team playing on Thursday is picked by 50% at game time, but only 80% of all entries have been submitted by then, they are really only picked by half of 80%, which means their final (and true) P% will end up at 40% (once the remaining 20% of entries are submitted later in the week).
So how can you calculate how much a Thursday teams P% will drop? Looking at the above example, at Thursday kickoff the entries look like: 40%: Thursday team, 40%: non-Thursday teams, 20%: not submitted. That means of the 60% of entries picking non-Thursday teams, 40% (or 66.7% of them) have been submitted by Thursday kickoff. Thus, if we know the percent of non-Thursday picks that have been submitted so far for the week, we can calculate where the P% will end up once all picks have been entered.
Because I have been tracking hourly pick data for years while running this site, I was able to use the data to model out the rate that non-Thursday picks were submitted throughout the week at each of the different pick sources I track. This can then be applied to the current week P% in order to project what the expected final P% once all entries have been submitted.
Below is an example using real P% from OFP for 2019 Week 8, where MIN was a big favorite on Thursday Night Football, showing how our model adjusted the P% during the week (the peak in the middle is TNF kickoff, and where they converge is Sunday morning kickoff).
As you can see, the dotted lines (for our adjusted P%) were much more stable throughout the week and more indicative of where the final P% would end up for each team.
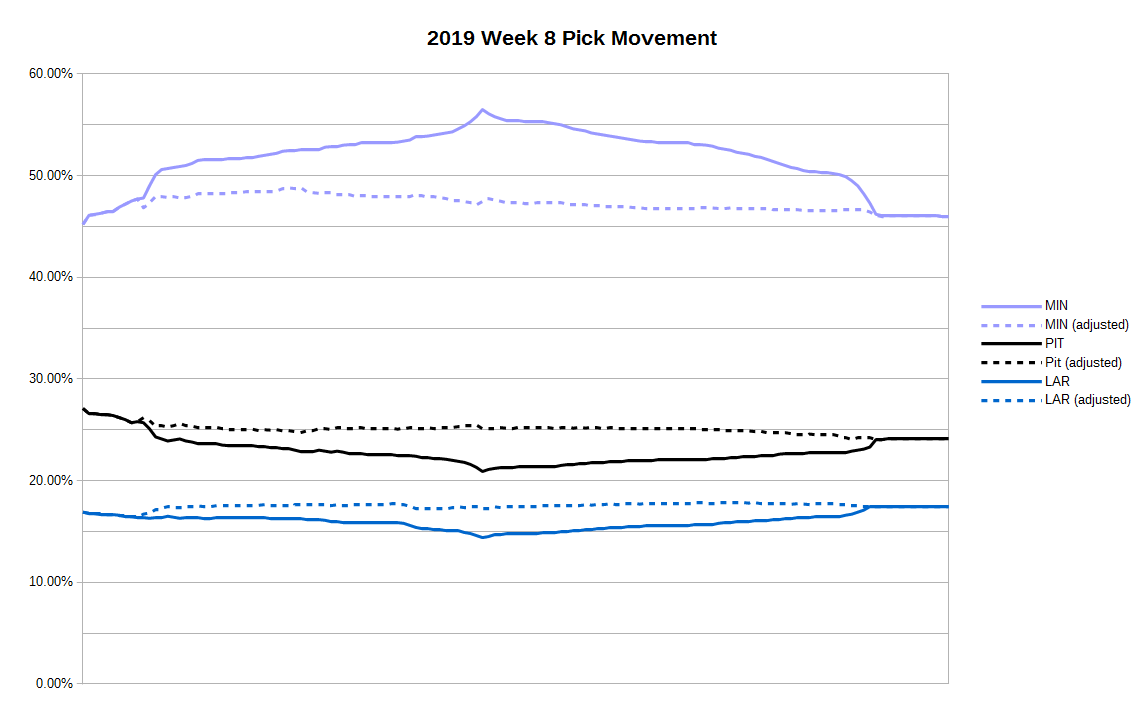
You can see how MIN P% peaks at kickoff Thursday as people get in their last-minute picks and then declines throughout the rest of the week as picks come in on other teams. Two other popular teams that week, PIT and LAR, who didn't play on Thursday, showed opposite movement as more picks came in on them late in the week, with another rush of last-minute entries before Sunday kickoff.